Information theory identifies the most informative molecular lines
Back to all ORION-B & DAOISM results
Observations of spectral lines are performed to improve our understanding of the interstellar medium (ISM). However, assessing quantitatively the potential of a line to constrain the physical conditions of the ISM is complex, even more so for combinations of lines. Observation campaigns thus usually observe as many lines as possible for as long as possible.
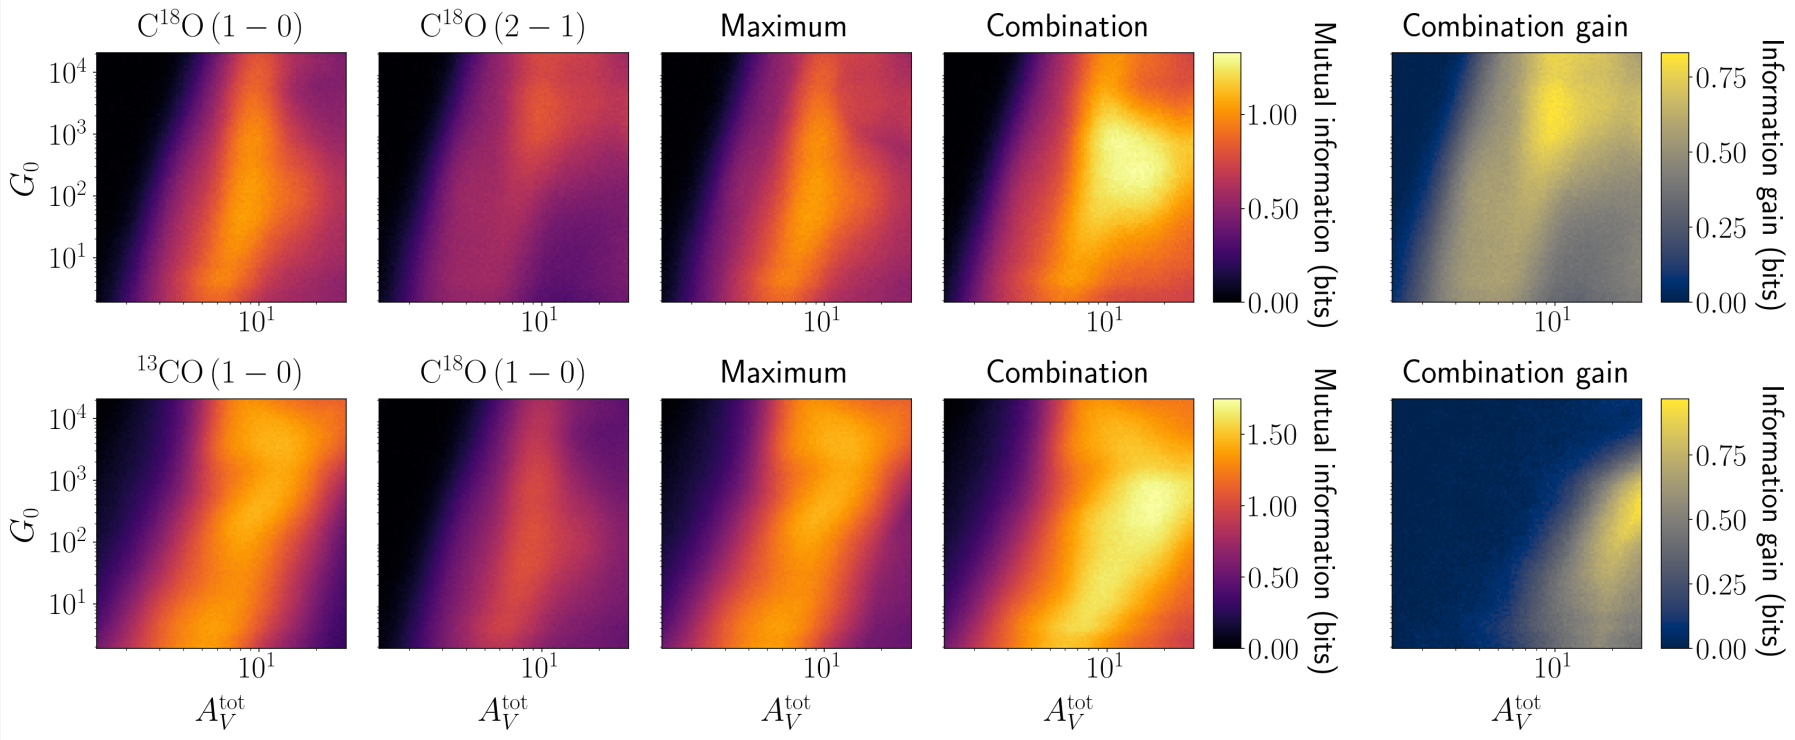
In this paper, we propose an approach that quantifies how well observing one or more lines can constrain a physical parameter. To do so, we resort to information theory and in particular mutual information. In fact, this statistic quantifies the average reduction in uncertainty on a given physical parameter resulting from the observation of a given set of lines. We illustrate our approach on synthetic observations — produced from an emulator of the Meudon PDR code and a simulator of IRAM 30m observations — to constrain the cloud visual extinction AV and the intensity of the incident UV field G0. We study how mutual information evolves with integration time, which could allow observers to optimize their proposals to achieve the highest constraining power with the minimum time budget. We also propose visualizations, called "information maps", of how mutual information evolves as a function of the physical regime (AV, G0) for a given line or set of lines. We show that combining lines provides information in regimes where none of the individual lines is informative, thanks to line complementarities (see figure). Finally, we compare mutual information values for multiple lines and sets of lines to determine which one best constrains a physical parameter. This could allow observers to select the most suitable lines to observe for a given physical environment. Due to line complementarities, the most informative set of lines does not necessarily combine the most informative individual lines.
Our results were obtained using this Python package. For you to perform a similar study in your context, we published the more general InfoVar package. To install it, simply run pip install infovar.
Figure: Comparison of information maps between millimeter lines and visual extinction AV. The first two columns of each row show the information brought by individual lines. The third column shows the maximum information brought by these lines taken individually, while the fourth column shows the information brought by their combination. Finally, the fifth column shows the difference between these two latter maps that can be interpreted as the gain in information brought about by the combination compared to the more informative individual lines.